For generations, Indonesian retail has relied on experience and intuition. Veteran shop owners knew which products to stock because they'd been running their stores for 30 years. They knew when to order more inventory because they had a "feeling" based on customer patterns.
But in 2018, something is changing. Years of POS data, e-commerce transactions, and customer interactions have created a goldmine of information. The retailers winning today aren't just experienced—they're data-driven.
The Data Goldmine You're Already Sitting On
If you've been running a modern POS system for even a year, you have:
Thousands of transaction records
Product performance data across seasons
Customer purchase patterns
Peak hour and day trends
Inventory turnover rates
Employee performance metrics
This isn't just data—it's business intelligence waiting to be unlocked.
Real-World Analytics Applications
1. Intelligent Inventory Management
The Old Way: Order based on what seemed to sell well, keep safety stock of everything, hope you don't run out of popular items or get stuck with dead stock.
The Data-Driven Way:
Identify your top 20% of products driving 80% of revenue
Calculate optimal reorder points based on historical velocity
Predict seasonal demand patterns
Identify slow-moving inventory before it becomes a problem
Real Result: A Jakarta electronics retailer reduced inventory carrying costs by 35% while simultaneously decreasing stockouts by 60%.
2. Dynamic Pricing Strategies
The Old Way: Set prices based on cost-plus markup, maybe run occasional promotions based on calendar dates.
The Data-Driven Way:
Analyze price elasticity to find optimal pricing
Identify products where customers are price-sensitive vs. brand-loyal
Time promotions based on actual buying patterns, not guesswork
Use competitive intelligence to position pricing strategically
Real Result: A fashion retailer increased gross margin by 12% by raising prices on low price-sensitivity items while being more aggressive on high-competition products.
3. Customer Segmentation and Personalization
The Old Way: Treat all customers the same, maybe have a simple loyalty card program.
The Data-driven Way:
Segment customers by purchase frequency, average transaction, and product preferences
Identify your VIP customers (top 10% by revenue)
Create targeted promotions based on purchase history
Predict customer churn and intervene proactively
Real Result: A beauty products retailer increased repeat purchase rate by 45% through personalized SMS promotions based on customer segments.
4. Operational Optimization
The Old Way: Schedule staff based on store hours, assign everyone similar responsibilities.
The Data-Driven Way:
Schedule staff based on historical traffic patterns (you need more people Saturday afternoon than Tuesday morning)
Identify top-performing employees and understand what makes them successful
Optimize checkout processes based on transaction time analysis
Reduce waste by analyzing product spoilage patterns
Real Result: A minimarket chain reduced labor costs by 18% while improving customer service scores by scheduling smarter, not harder.
The Technology Making This Possible
You don't need to be a data scientist to benefit from analytics:
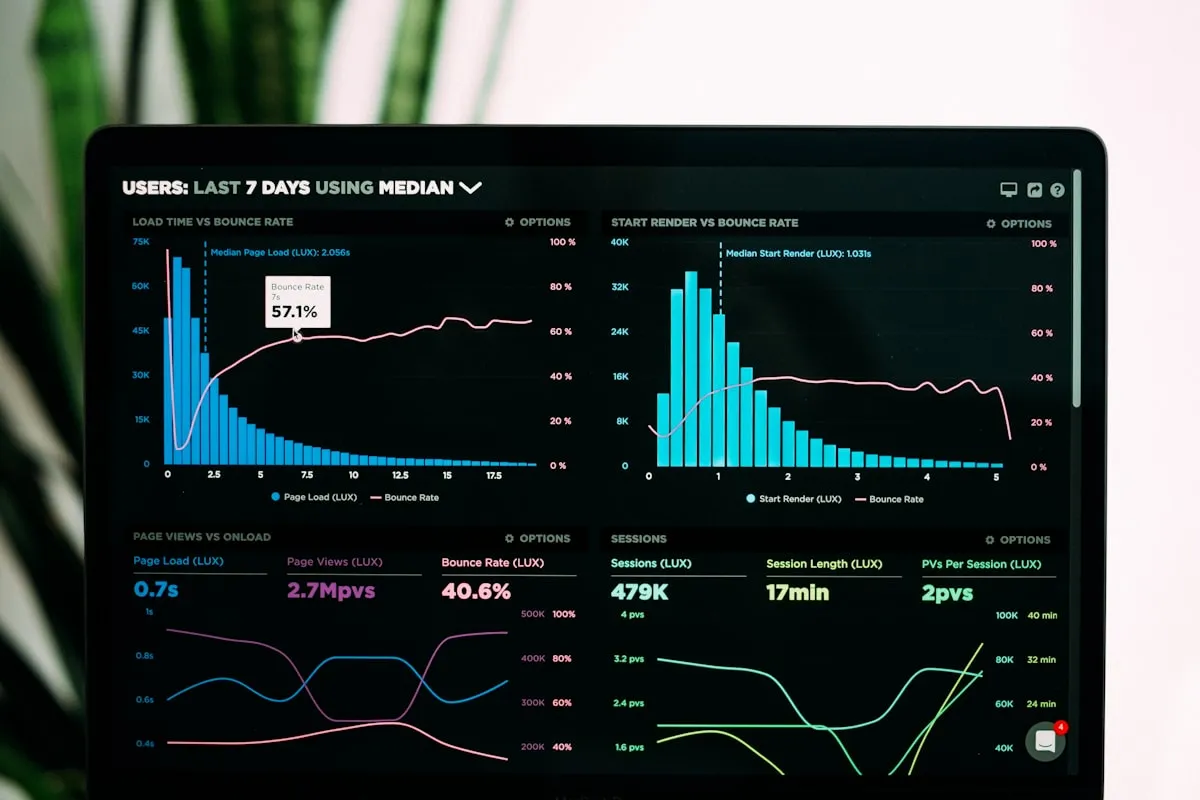
Built-in POS Analytics: Modern cloud POS systems include dashboard reporting that visualizes key metrics automatically.
Excel Power Users: With POS data exports, even Excel can produce powerful insights through pivot tables and charts.
Business Intelligence Tools: Platforms like Tableau, Power BI, or Google Data Studio can connect to your POS database and create sophisticated visualizations.
Predictive Analytics: More advanced retailers are using machine learning tools to forecast demand, optimize pricing, and identify trends.
Success Story: A Jakarta Department Store
A mid-sized department store implemented data-driven operations in 2017:
Before Analytics:
Inventory decisions based on buyer intuition
Promotional calendar based on traditional shopping seasons
Customer loyalty program with 15% redemption rate
Gross margin: 28%
After 12 Months of Data-Driven Operations:
Automated reordering for top 500 SKUs based on velocity
Promotions timed to actual buying patterns (Thursday-Saturday surge)
Segmented loyalty program with personalized offers
Gross margin: 33%
Inventory turnover increased from 4x to 6.5x annually
Customer retention improved 31%
Total impact: Rp 2.4 billion additional annual profit from the same square footage and similar revenue.
Common Analytics Pitfalls to Avoid
Analysis Paralysis: Don't get lost in data. Start with 3-5 key metrics that matter most to your business.
Ignoring Context: Data shows what happened, but you need business knowledge to understand why and what to do about it.
One-Time Analysis: Analytics isn't a project—it's an ongoing discipline. Set up dashboards you review weekly or monthly.
Over-Complicating: Start simple. Basic analytics done consistently beats sophisticated analytics done occasionally.
The Competitive Divide
Here's the reality in 2018: Your competitors are getting smarter. The ones investing in data analytics are:
Optimizing faster than you
Understanding customers better than you
Operating more efficiently than you
Making better decisions than you
The gap between data-driven retailers and intuition-driven retailers is widening every month.
Getting Started with Analytics
Week 1: Identify your top 3 business questions
What are my best and worst performing products?
When are my peak sales times?
Who are my most valuable customers?
Week 2: Pull data from your POS system and create basic reports
Week 3: Review findings with your team and identify one action to take
Week 4: Implement that action and measure results
Repeat: Add new questions, deepen analysis, expand impact
The Future Is Now
Indonesian retail is at an inflection point. The businesses that embrace data analytics in 2018 will build advantages that compound over time:
Better decisions lead to better results
Better results create more data
More data enables even better decisions
Meanwhile, competitors relying solely on intuition will find their "gut feelings" increasingly outmatched by data-driven intelligence.
Conclusion
Moving from intuition to analytics doesn't mean abandoning experience—it means augmenting it. The best retailers in 2018 combine deep business knowledge with data-driven insights.
Your data is already there, collecting in your POS system. The question is: will you use it to gain a competitive advantage, or will you let your competitors do it first?
The age of "I think" is giving way to the age of "I know." Which side of that divide will your business be on?
Tags
Ready to Transform Your Business?
Get expert guidance on implementing AI solutions in your organization.
Contact